Most companies have made commitments to reduce their greenhouse (GHG) emissions from their operations, such as heat in buildings or electricity from offices, also known as scope 1 and 2. With more ambitious pledges being made to be net-zero or carbon neutral, companies must now account for scope 3 emissions, which can often comprise up to 90% of a company’s total emissions depending on the industry.
As GHG disclosure continues to be a central part of environmental reporting, it is important for companies to incorporate scope 3 to understand the bigger picture of where emission hot spots are in the value chain and use this analysis to develop strategic targets and goals.
What is Scope 3?
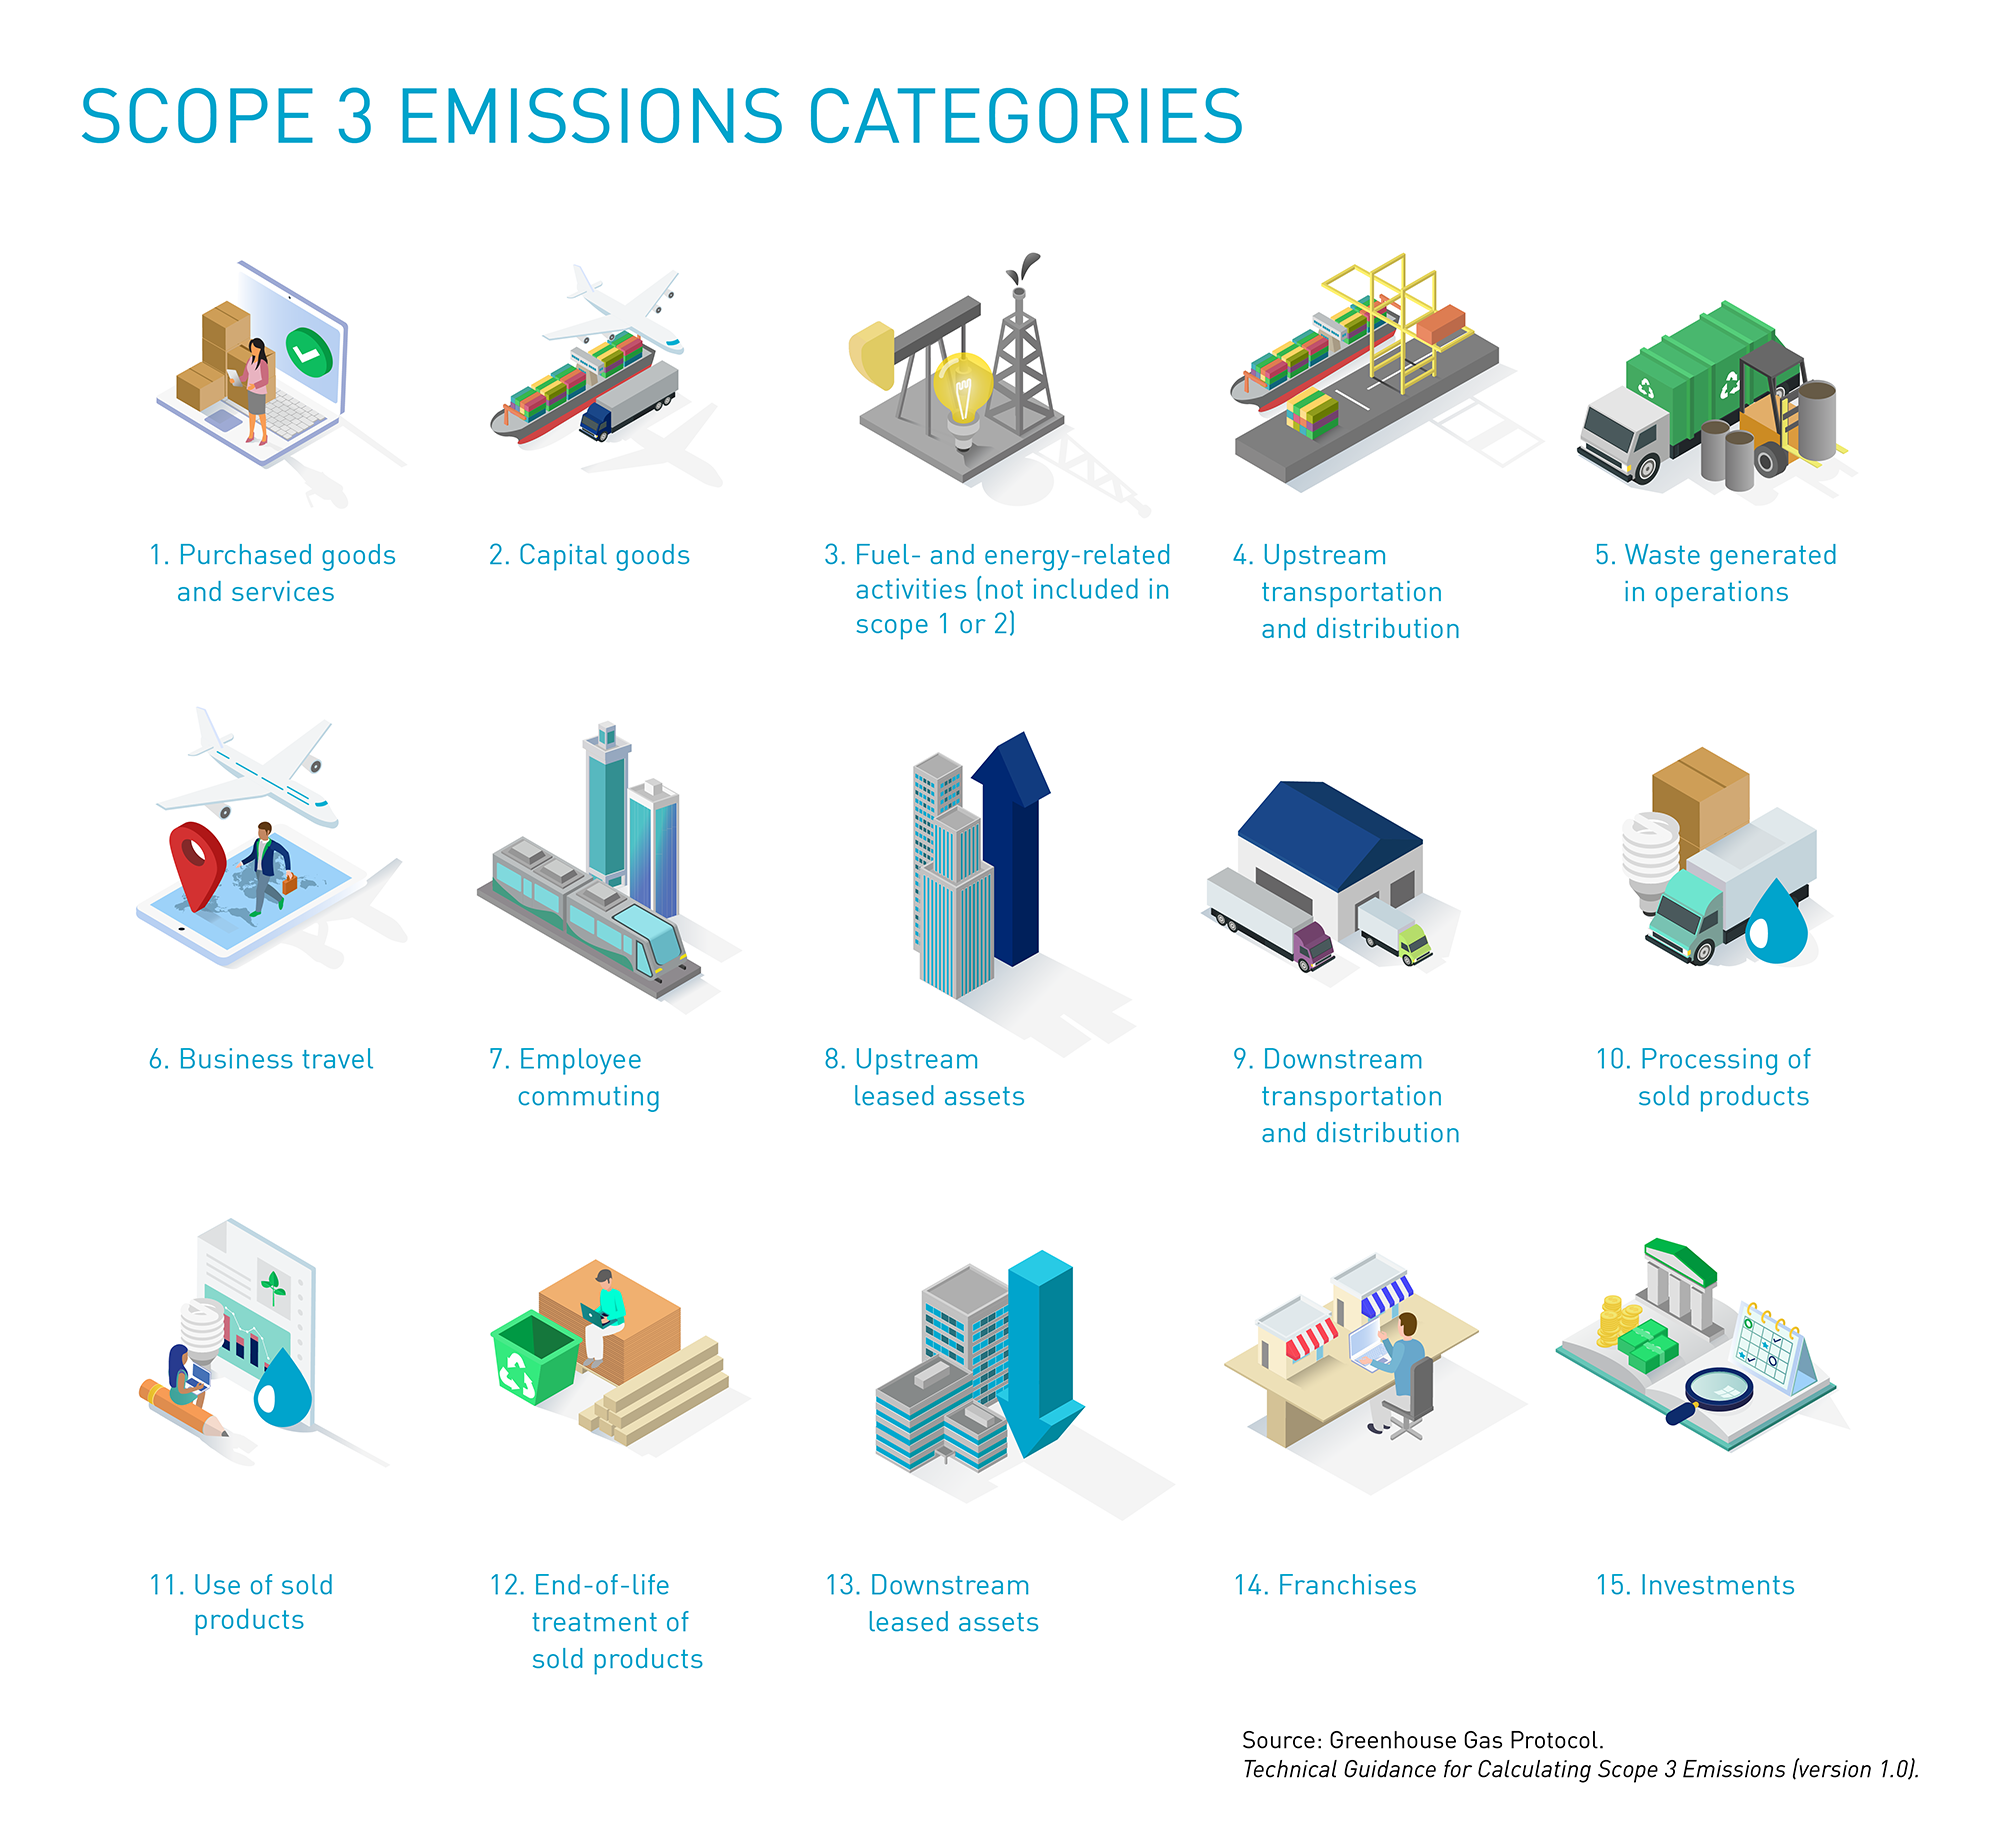
Scope 3 is defined as indirect emissions that occur in the value chain. Emissions are sorted into 15 categories, as defined by the Greenhouse Gas Protocol, including capital goods, investments, and employee commuting. There are often challenges with assessing and calculating scope 3 emissions, as they are often not in a company’s direct control. The data needed to calculate scope 3 can vary widely, as opposed to scope 1 and 2 which rely heavily on utility bills and consumption records.
For example, for Category 1: Purchased Goods and Services, you may need to engage your Procurement team to gather company-wide spend data. For Category 4: Upstream Transportation and Distribution, you may work with your Supply Chain and Logistics teams to understand the origin and destination locations of ports for all imports, the mode of transportation, and the distance traveled for each import.

The Calculation Process
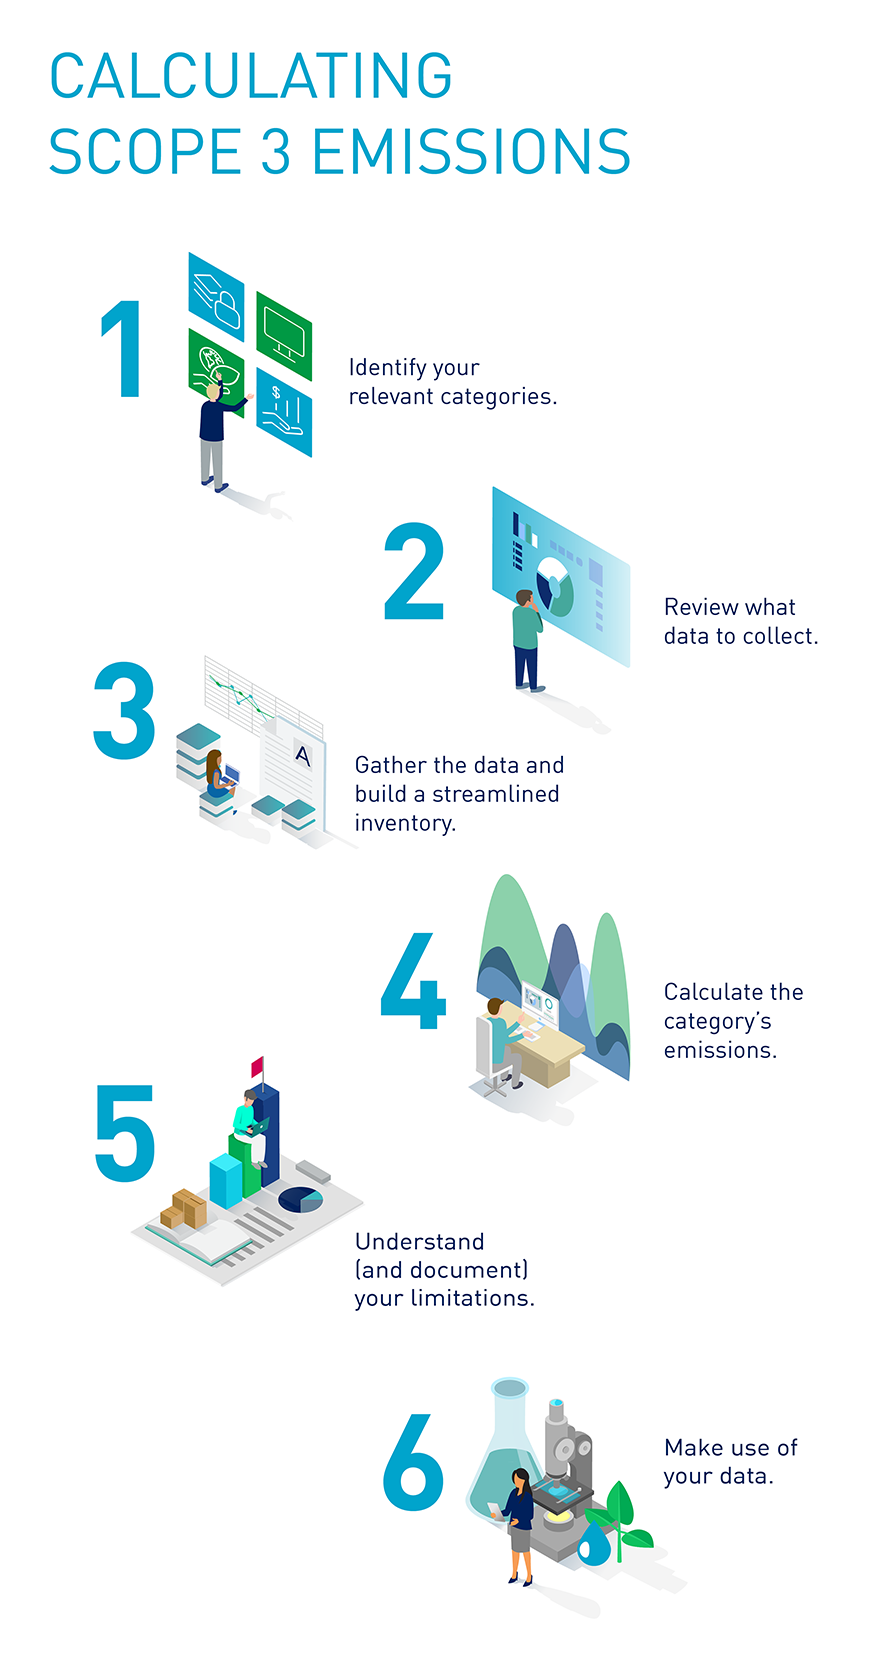
1. Identify your relevant categories.
Most likely, not all 15 categories will be relevant to your company. For some, this will be obvious, e.g., your company does not have any Franchises (Category 14). Others may be more ambiguous, and you may need to do more digging and evaluate them further. Review each category description to get a better understanding of what goes into each category and what activities at your company would be included for each. And remember, just because you can’t directly control the emissions from a category does not mean it is irrelevant.
2. Review what data to collect.
Each category description contains a section that shows the calculation methodology and the data needed for the calculation, with some categories that feature different methods. For example, Category 2: Capital Goods, has four different calculation methods such as the “supplier-specific” or “hybrid” method.
3. Gather the data and build a streamlined inventory.
As a company gathers more and more data from its value chain, the inventory can easily become overwhelming. During this time, it is best to organize what’s been collected as seamlessly as possible so year-over-year calculations can be performed and progress against targets can be measured. This means making sure that databases are completed with all the necessary data points so that calculations are easy to navigate through filtration, and are consistent from year to year.
4. Calculate the category’s emissions.
After the data has been collected you are now ready for calculations. Refer back to the category description to find the appropriate calculation methodology. The output should provide the total emissions for that category.
5. Understand (and document) your limitations.
Data availability and quality may be lacking for some categories. Therefore, it’s important to make note of any assumptions or estimates, so that these can be accounted for in the future. For example, let’s say the only calculation method that can be performed for Category 1: Purchased Goods and Services is using the spend-method, where the necessary data needed to calculate this is the total amount spent on all purchased goods and services. While using this method provides an estimation of emissions based on spending, it is solely an estimation. In most cases, using the supplier-specific method, which requires obtaining direct supplier data, will provide a more accurate figure — but this can be extremely difficult to obtain. This is an instance where you would want to document to obtain accurate data in the future.
6. Make use of your data.
After calculating your emissions, you are now ready to utilize this information to make a difference in your organization. Data can be used for disclosure reporting, to help certify for Science Based Targets, or to figure out hot spots in the value chain to focus on specific targets.
Process in Action: Scope 3 Calculations for “Ziggy’s Scooters”
To help illustrate the scope 3 calculation process, let’s see how fictional company Ziggy’s Scooters (ZS), an electric scooter retailer, calculates some of its emissions.
1. Identify your relevant categories.
ZS has identified that ten scope 3 categories are applicable to its value chain. For the purposes of this example, we’ll focus on Category 7: Employee Commute.
2. Review what data to collect.
Category 7 lists three possible calculation methods. Prior to selecting a calculation method, it’s best to look at what data is already available and select from there. For this example, since ZS only knows the total distances traveled by transportation type for its employee commuters, the distance-method will be used. In addition, the total distance must be multiplied by an emissions factor related to the transportation method used. Therefore, we will need to research these values.
3. Gather the data and build a streamlined inventory.
Now that ZS has identified the data it needs, the next step is to organize the raw employee commute data alongside the emissions factors where the ease of calculations can be performed. Note that there is no all-in-one answer on how this should be formatted, so it is important to collaborate with your team to figure out how the final outputs are to be envisioned.
4. Calculate the category’s emissions.
Check back on the calculation methodology to proceed in this step and make sure the units are converted accordingly.
5. Understand (and document) your limitations.
Some of ZS’s commuting employees are based in Sri Lanka, but ZS isn’t currently able to obtain accurate emissions factors in that country. Instead, they defer to using an average of neighboring countries’ emissions factors. ZS will make note of this so that when an emissions factor for different types of transportation modes becomes available, they will be able to calculate the emissions more accurately.
6. Make use of your data.
After reviewing the numbers, ZS sees that a large portion of their emissions from employee commute are due to single-occupancy vehicles that live within 20 miles of the company. If ZS has a target to reduce employee commute emissions, they can potentially roll out a public transportation program where ZS will purchase annual public transportation passes for employees who live within 20 miles of the company.
Although quantifying scope 3 can be overwhelming, it’s important to remember that the road towards building a thorough inventory is a journey. If your sustainability team is just starting to look at quantifying their scope 3 emissions, they should begin with categories with data that is most accessible—even if those emissions only represent a small percentage of the larger picture. Rough estimates can easily be attained with online resources such as Quantis’s Scope 3 Evaluator, where only the spend data is required per category. Platforms such as CDP Supply Chain Program or EcoVadis can help with gathering data from suppliers and partners. Once the necessary data is more accessible, you can further refine your calculations and close your gaps.

ADEC ESG Solutions is a leading provider of sustainability solutions, including fully-integrated industry expertise, software solutions, and data management. Click here to learn more about how our team can help you track and manage ESG data, set targets, and integrate ESG factors into your strategy.


